


Study design
The present FIO-STRIDE study utilises data from the STRIDE study [4] to evaluate differences in purchase and consumption habits between PLWOw/Obwith and PLWOw/Obwithout. Calorific screening thresholds were used to remove participants whose purchases were unlikely to represent a substantial proportion of their diet within the study period. Bland-Altman analyses [13] were used to evaluate the agreement and bias between purchase and consumption data, before considering differences by weight status. The original STRIDE study was granted ethical approval by the Social Science Environment and LUBS (AREA) Faculty Research Ethics Committee, University of Leeds on 15 July 2019, with an updated approval on 2nd December 2023 for this follow-on ‘FIO-STRIDE’ study (AREA18-174). Written informed consent was obtained from all participants. All methods were performed in accordance with the relevant guidelines and regulations.
Overview of original STRIDE study
This section provides a brief overview of the elements of the original STRIDE study relevant to the present FIO-STRIDE study—further details can be found in the original study [4]. Differences in the preprocessing steps between the previous STRIDE study and this FIO-STRIDE study, and the additional analyses considered within the present study are outlined in subsequent sections.
Participants
A total of 1 788 participants consented to take part in the original study [4], after approximately 45 000 eligible customers from the retailer’s loyalty card customer database were contacted by the retailer. To be eligible, participants had to be classified as ‘primary shoppers’—defined by the research team in the original STRIDE study, as shoppers who purchased in at least 7 out of 15 food categories on at least 10 occasions in 2019 [4, 14]. This definition was used to exclude customers who only made occasional purchases with the retailer or who only bought specific types of food in the year prior to the study. Participants completed an online questionnaire providing demographic and anthropometric information (date of birth, gender, ethnicity, height, weight and household composition—i.e. the number and ages of other people within their household) and consented to their supermarket transaction records being linked to their weight status.
Food frequency questionnaires
Participants completed a validated 170-item semi-quantitative online FFQ from the Scottish Collaborative Group (SCG) [15, 16] to provide details on individual dietary consumption. The FFQ asked the participant to report the frequency (number of days per week) and amounts of each item (number of measures per day) consumed over the previous three months, capturing their usual dietary intake. The 170-items were split into 21 categories: breads; breakfast cereals; milk; cream and yoghurt; cheese; eggs; meats; fish; potatoes, rice and pasta; savoury foods, soups and sauces; vegetables; fruit; puddings; chocolates, sweets, nuts and crisps; biscuits; cakes; spreads and sugar; beverages and soft drinks; alcoholic drinks; other foods and drinks; and vitamin, mineral and food supplements. A previous validation study against an unweighed 7-day food diary reported Spearman correlation coefficients of: 0.37 for energy; 0.48 for fat; 0.58 for saturated fat; 0.47 for protein; and 0.62 for total sugars in 96 adults aged 18–65 years old [16]. Daily nutrient intakes for each participant were estimated from their FFQ by the SCG team as part of their paid FFQ service, using the United Kingdom (UK) National Nutrient Databank [15]. Six nutrients were considered: total energy (Kcal/day); total sugars (g/day); total fat (g/day); total saturated fat (g/day); total protein (g/day) and total sodium (mg/day). These nutrients were chosen to enable comparison with supermarket transaction data using back-of-pack information, as this information is mandatory for products in the UK. For the remainder of the present study, these daily nutrient intakes, calculated from the FFQ, are termed the estimated individual nutrient intake.
Supermarket transaction data
Household purchases were provided by the retailer in the form of supermarket transaction data from loyalty cards. These data included all food and beverages (including alcoholic beverages) purchased either in store or online with a scanned loyalty card. Household purchased nutrients were estimated from the transaction data by linking products to a product nutrient composition database, based on product data supplied by NIQ Brandbank © 2024 [17], via a unique product code (either the European Article Number (EAN) or Stock-Keeping Unit (SKU)). Mean daily household purchased nutrients were calculated by dividing the total household nutrients purchased by the number of days in the same 3-month timeframe as that covered by the FFQ [4].
Estimated individual purchased nutrients were calculated by proportionally allocating the mean daily household purchased nutrients to the study participant according to UK dietary recommendations for caloric intake by age and gender [10]. As the sex of other household members was unknown, an average of recommended values for males and females was used for those individuals. The study participant was allocated their proportion of the total recommended caloric intake for the household—Table 1 provides an example of this process.
These estimated individual purchased nutrients were provided as absolute daily amounts for the individual participating in the study to allow for comparison with the estimated individual nutrient intake (provided by the FFQ).
Preprocessing differences in the present FIO-STRIDE study
Estimation of weight status
To allow comparisons to be made between weight statuses in the present FIO-STRIDE study, participants were grouped according to body mass index (BMI), calculated using self-reported height and weight. Participants were classified as PLWOw/Obwith (BMI ≥ 25) or PLWOw/Obwithout (BMI < 25).
Screening thresholds
Calorific screening thresholds were used to include/remove customers based on the quantity of food and drinks purchased within the 3-month study period. These thresholds aimed to remove participants whose estimated purchases could not realistically represent their total consumption. The screening thresholds used the estimated individual purchased nutrient values, which only required supermarket transaction data and household composition information. The estimated individual purchased calories value was used for the screening thresholds as it provided a global view of the quantity of household purchases estimated to be purchased for the individual. Since estimates are subject to error (e.g. from household members consuming different proportions of food than the recommended guidelines and from purchases outside of the supermarket or made without the loyalty card), six screening thresholds were considered using estimated individual purchased calories values of: >0 Kcal/day (n = 642); ≥500 Kcal/day (n = 435); ≥1000 Kcal/day (n = 299); ≥1500 Kcal/day (n = 184); ≥2000 Kcal/day (n = 108) and ≥2500 Kcal/day (n = 49).
Statistical analyses
Following the removal of participants who did not complete FFQs (n = 963), had estimated daily energy intake from the FFQ > 8000 Kcal/day (n = 2), made no purchases with the retailer in the same 3-month timeframe as the FFQ (n = 137) or did not provide heights and/or weights for BMI to be calculated (n = 44), a final sample size of 642 participants was present for this study. Bland-Altman analyses were used to assess the agreement and bias between estimated individual nutrient intake (from FFQ data) and estimated individual purchased nutrients (from supermarket transaction data), as this is the standard method for comparing methods in clinical research [13]. Supermarket transaction data were used as the reference value, framing the research question as “how much is an individual estimated to consume relative to their estimated purchases?”.
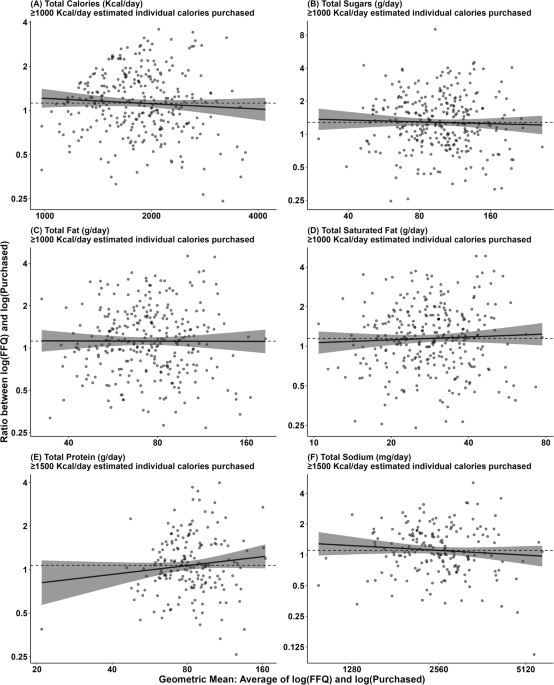
Prior to analysis, daily nutrient values were log-transformed so proportional differences were considered. Two Bland-Altman analyses were performed at each of the six calorific screening thresholds (i.e. using only data from the participants who exceeded the screening thresholds) for each of the six nutrients considered in this study (total energy (Kcal/day); total sugars (g/day); total fat (g/day); total saturated fat (g/day); total protein (g/day) and total sodium (mg/day)). The first assessed the agreement and bias between estimated individual nutrient intake and estimated individual purchased nutrients across the six screening thresholds without comparing by weight status. The second included weight status as a covariate within the modelling process to evaluate differences in agreement and bias across each nutrient between PLWOw/Obwith and PLWOw/Obwithout.
Agreement and bias
Two measures were taken from the Bland-Altman analyses: agreement and bias. Agreement refers to the consistency of mean differences across a range of values. As data in this study were log transformed, agreement was reached if the proportional differences were the same across a range of nutrient values. This means that agreement was reached if, for example, on average, an individual consumed 10% more, or less, than they were estimated to have purchased across a range of values (e.g. consistently from 500 Kcal/day purchased (absolute difference 50 Kcal/day) up to 2500 Kcal/day purchased (absolute difference (250 Kcal/day)). Agreement between estimated individual nutrient intake and estimated individual purchased nutrients was deemed to have been achieved statistically if the 95% confidence intervals of the regression coefficient for the mean value did not cross zero. Visually, agreement was seen if the regression line was horizontal or near horizontal.
Bias is the mean difference between what is consumed (FFQ) and what is purchased (supermarket transaction data). In this study, this is the proportional difference between estimated individual nutrient intake and estimated individual purchased nutrients (e.g. individuals were estimated to consume 10% more or less of a nutrient than they were estimated to have purchased). Two types of bias are provided: the back-transformed mean of the raw log-transformed differences and the modelled bias at the average nutrient values. The back-transformed mean of the raw log-transformed differences assumes agreement is present (i.e. it will always be horizontal), whereas the modelled version provides the bias and additionally shows whether agreement is present (i.e. it will not always be horizontal). It is important to note that bias can be present even if agreement is reached. For example, the data could show that there is a 20% difference between estimated individual nutrient intake and estimated individual purchased nutrients (i.e. there is bias in the data), but this difference may be consistent across a range of nutrient intakes (i.e. there is agreement in the data). Where this happens, bias is thought to provide insights into purchase and consumption behaviours, since the differences are consistent across a range of nutrient intakes.
To provide further insight into the differences in purchase and consumption behaviours between weight statuses, a mean expected individual consumption value was calculated for each nutrient for PLWOw/Obwith and PLWOw/Obwithout. This allowed differences in bias and the quantity of food purchased to be considered together in ‘real terms’ between weight statuses. Mean expected individual consumption values were calculated by multiplying the mean estimated individual purchased nutrient value by the modelled bias value for the weight status group. Differences between weight statuses were deemed to be statistically clear when the confidence intervals of the expected consumption values between groups did not overlap.
Data collation, preprocessing and analysis were handled in the LASER secure data environment at the University of Leeds [18]. All analyses were conducted using the lm() function in R (v4.3.0).
